

ethdebug: a shared language for debug data, in use across projects today
- Published on
More compilers now write ethdebug data, and tools have started to read it. This post shows what that data does today, how you can build on it, and what comes next for the ethdebug format.
The ethdebug format is an open specification for how compilers structure their debug data. It lets compilers explain their output to tools. Without it, tools reverse-engineer each compiler's choices, version by version. A subtly wrong guess raises no error, so people can act on a wrong balance or owner without knowing it.
The ethdebug project is part of Argot Collective. In this, our first post on the Argot blog, we share our latest progress in Ethereum debugging. We'll start with what changed this year, including the work that the Solidity team and Walnut, a team that builds Ethereum debugging tools, began in May to extend solc's ethdebug data. Then we'll show what tools must guess without the compiler's help, and how the format removes the guesswork. Most of the interactive figures run on real compiler data.
What changed this year
Since our talk at the Solidity Summit last November, Fe and Solar have started to write initial ethdebug data. For solc, work now in review would let tools find a contract's state from solc's own data. Walnut's soldb, a debugger for Solidity, reads ethdebug data. Runtime Verification, the team behind the Simbolik debugger, has started a Python library to read it.
The Solidity team added ethdebug data to solc in 0.8.29, in March 2025. It maps each instruction to its source range, the part of the source code that the instruction came from. Since May, Walnut has been extending that output in stages, each one a pull request that the Solidity team reviews. The stage now in review (argotorg/solidity#16990) describes how a contract lays out its storage. In our tests, it matches what solc's storage layout output already says. Walnut is still building the next stages, for state variables, function parameters, and return values, on their fork.
Walnut has also been helping shape the format. Their questions led to improvements (ethdebug/format#307). To support their solc work, they wrote a conformance test suite (ethdebug/format#215). It checks how closely compilers and debuggers follow the format. Today it covers just solc, soldb, and the format's own reference implementations.
In solc's latest release, 0.8.38, its ethdebug output is experimental, and it needs the IR pipeline with the optimizer off. In that release, the data only maps each instruction to its source range. The figures in this post use a preview build with Walnut's work in progress. Next, Argot and Walnut would like to add local variables together, and then optimized code. Support for optimized code would lift the optimizer-off restriction.
The Fe compiler, another Argot Collective project, writes ethdebug data for each instruction and its source range, with the optimizer on. It puts that data inside a small wrapper of its own, which a tool must remove first. Solar, a second Solidity compiler from Paradigm, writes ethdebug data on its main branch, also with the optimizer on.
So far, compilers' ethdebug data mostly tells a debugger which part of the source each instruction came from. With the optimizer on, even that takes work. The harder part is for a compiler to describe where it put each variable, in whatever code its optimizer produces. No production compiler does that yet.
The format also helps people who use AI to build tools. In the 2025 Solidity Developer Survey, nearly nine out of ten developers said they use AI at least monthly, and nearly half said they distrust its output. A tool that reads ethdebug data doesn't need to know how the compiler works inside. So an AI that writes such a tool has less to get wrong. The tool reports what the compiler says instead of guessing.
Read on if you build or use debugging tools, or if you're curious how they work. The rest of this post shows what tools lose without ethdebug data, how a debugger reads it, and what comes next. Explore the figures as you go.
What we're solving
Contracts run as bytecode, and without the compiler's help, mapping that bytecode back to the source is guesswork. An optimizer makes it harder still when it inlines, reorders, and merges code.
Developers need to see a running contract in its source's terms while they build. In the 2025 Solidity Developer Survey, a third of developers named debugging as a recurring problem, at every level of experience. Incident responders need the same view after an attack, when funds may be at risk. Responders work with contracts that were compiled before the format existed, so someone has to write their ethdebug data afterward. We come back to how in the section "The harder cases" below.
Many teams have built debuggers and other tools that show a contract in its source's terms. Compilers have given those tools enough to work, but only with guesswork. Tool authors learn the compiler's rules by studying its output and add special cases for each version. Six open-source projects, Remix and Truffle among them, have each built their own decoder for solc's existing outputs. Truffle's decoder grew to 24,000 lines of rules learned from the compiler before Consensys retired Truffle in 2023. The format builds on its lessons. Even Foundry, today's most-used toolkit, finds function names by parsing the source text. Its tracking issue for debugger improvements has been open since 2022.
To show what that guesswork involves, this post uses one small example throughout. It's a multiplayer game where players join and make moves that can earn them points. In the middle of a transaction, a development tool sees the game's state as raw bytes. The figure below shows those bytes, and then which variable each one belongs to.

With enough debug data from the compiler, a tool can show which variable each byte belongs to.
A tool can be sure which variable each byte belongs to only when the compiler says how to find each variable's bytes. Without that, a tool works out each variable's location on its own. It must know where solc puts mapping entries, how it packs small values into one slot, and how it lays out a string. The rules change with compiler versions and optimizers. Old contracts stay on chain, so tools must keep every old rule too. Most tools support only some compiler versions, and many can't read optimized code, which is what runs on mainnet. A wrong guess gives no error. The tool just shows a wrong value.
To find Alice's score, a tool hashes her address with the slot of the players mapping, using keccak, Ethereum's standard hash function. That gives the first slot of her record. The tool then picks her score out of six small fields packed into that slot. Her name is in the next slot, with its characters at one end and its length at the other.

Alice's record, as the compiler's data describes it. The gray rows are what the tool reads to find the record. Mappings don't store their keys, so the tool takes Alice's address from the game's list of players. Click parts of the record to explore them, and press ↺ Reset to go back.
Each new language means learning these rules again. The new rules often differ from Solidity's in small ways that are easy to miss. Vyper also hashes the key with the mapping's slot, but in the opposite order. It puts players at slot 108, not slot 3. A tool that applies Solidity's rule to Vyper's storage finds an empty slot that looks just as valid, and reports that Alice's score is 0.
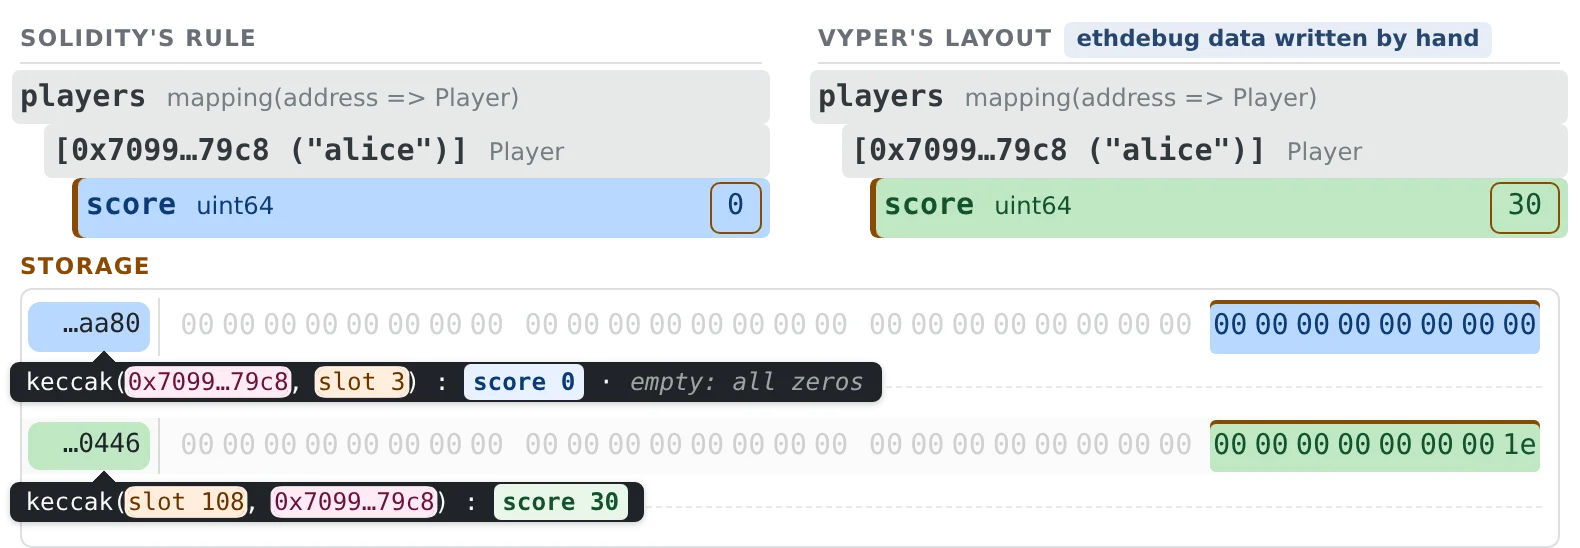
The same storage, read two ways. Solidity's rule hashes Alice's address before the slot and lands on an empty slot, so her score reads 0. Vyper's layout hashes the slot first and finds her real score: 30.
The ethdebug format moves the rule into the compiler's output. The compiler already knows where it put every value, so it writes the rule down. A tool then follows whatever rule it is given. In the figure above, the reading that uses Vyper's layout works this way, from ethdebug data we wrote by hand.
To show Alice's real score of 30, a tool also has to know what those bytes mean. The format's way to describe types isn't yet good enough for that. We're reworking its type schemas for the richer type systems of newer languages. Until then, the figures in this post read the bytes with their own code.
Reading compiled code
The first thing a debugger needs is which piece of source each instruction came from. Walnut wrote soldb for Solidity, but because it reads ethdebug data, it can also step through a contract written in Fe. soldb's code didn't change. We only had to collect the source files alongside Fe's ethdebug output. The figure below runs soldb in this page on one of the game's transactions, compiled once with solc and once with Fe. Switch between the two and step through each. soldb shows no call stack here because neither compiler marks function calls in its ethdebug data yet.
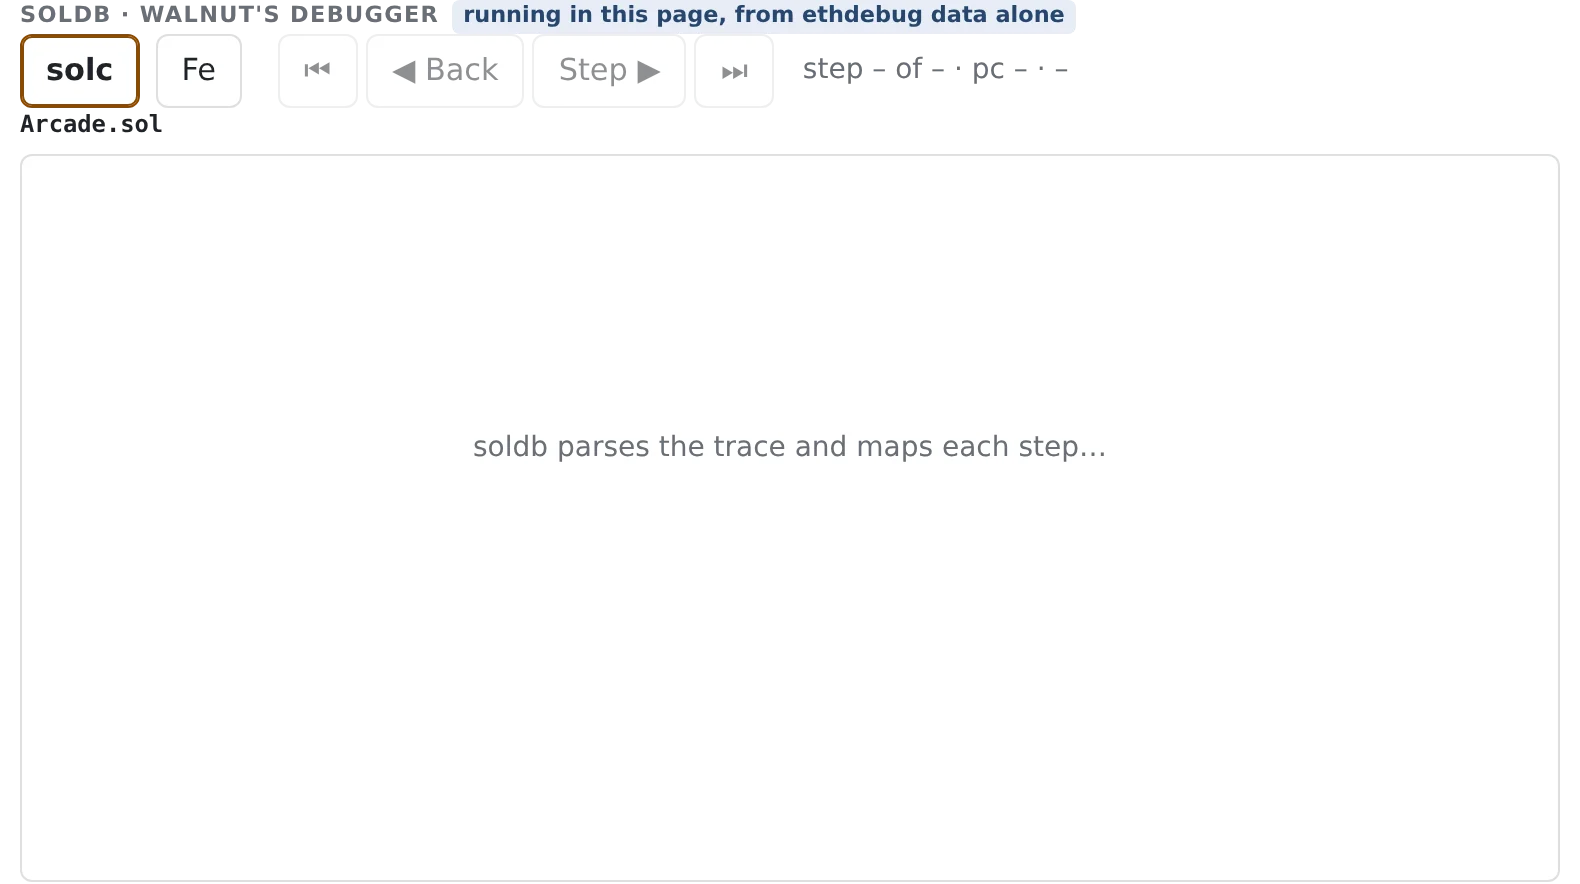
soldb stepping one of the game's transactions, compiled from Solidity and from Fe.
The format describes compiled code as ethdebug programs. Each program covers either a contract's creation code, which deploys it, or its runtime code, which runs on each call. For each program, the compiler lists the instructions in order. Each instruction gives its byte offset in the bytecode, its operation, and an ethdebug context. The context says what is true after the instruction runs.
The simplest kind of context says which range of which source file the instruction came from. Every compiler that writes ethdebug data writes this kind of context today. It is all that soldb needed to follow the source. Other kinds describe variables and code the optimizer moved or merged. Some mark where a function call starts and ends and name the function, even when the optimizer inlined the call. Solar's main branch has started to write those. Later in this post, we show these kinds of context from a compiler we built to test the format.
solc and Fe write ethdebug programs in the same basic shape, so the same code can read both. Click an instruction below to see its entry.

Part of play(), as solc and Fe each wrote it. There is one entry per instruction, with its offset, its operation, and its context. Click an instruction to see its entry and the source its range points to. Fe adds a few fields of its own.
Finding a variable's bytes
A compiler describes each variable with an ethdebug pointer. Unlike a pointer in most languages, it isn't a fixed address. It says which location (storage, memory, the stack, and so on) holds the variable's bytes and how to compute their positions from the machine state a tool can observe. To follow the pointer, a tool might read a slot, hash a key with the slot's number, or move to the next slot. When the compiler uses a pointer shape again and again, like a mapping or a string, it writes a pointer template once and reuses it.
The figure below follows the compiler's ethdebug pointer for the players mapping. It goes from the slot where players starts to every byte of every player's record. Click ▶ to step through it, or click any other variable and step through its pointer.

Each step shows one piece of the compiler's ethdebug pointer for players, and the storage that piece reaches. The steps go from slot 3 to each record at keccak(key, slot 3), and then to the six packed fields and each player's name.
The figure ran those steps with our TypeScript reference implementation, the @ethdebug/pointers npm package. That package knows nothing about this game or about Solidity. The keys came from the game's list of players, and every rule after that came from the compiler's data. For the Vyper version of the game, the pointer would hash the slot before the key and start at slot 108. The same package would follow it unchanged, and no tool author would have to learn either compiler's rules.
The harder cases
One ethdebug pointer was enough for players because its place in storage is set once and never moves. A local variable's location can change as the code runs. It can move to a different part of memory, or leave the stack for a while. An optimizer inlines calls and reuses one variable's bytes for another. solc's source maps and storage layout output have no way to say so. The ethdebug format lets a compiler say where each local variable is at each instruction. No production compiler writes local variables yet. bugc, the format's reference compiler, does. It compiles BUG, a small language we made to test the format. bugc's optimizer exists for the same reason. It inlines calls and reuses bytes the way solc's optimizer does, so we can test the format on that kind of code. Do not use BUG in production. Its compiler was not built to save gas, and it has never been audited.
The figure below follows three of the game's transactions, rewritten in BUG and compiled with bugc's optimizer on. In the game, each move is a hit or a miss, and hits in a row earn more points. Carol joins, Alice plays and hits, and Bob plays and misses. The figure stops at a few moments in each transaction. At each one, the compiler's ethdebug pointers say where each local variable's bytes are. They can be on the stack, in calldata, or in memory. Watch mult, the points multiplier, take over the bytes of combo, the count of hits in a row, instead of copying them. Use ◀ ▶ to go from one moment to the next. Each press runs every instruction between the two.

The game in BUG, compiled at optimization level 2. Where each local variable is at each moment comes from the compiler's ethdebug pointers.
The figure shows that a compiler can already use the format to say where its optimizer puts each local variable, and that a tool can read it. The format has no way yet for a compiler to say how to compute a value that isn't anywhere in the machine. We're also still settling exactly when a call's frame starts and ends (ethdebug/format#348).
Almost every contract on chain today was compiled before its compiler wrote ethdebug data. Those old compiler versions won't be updated to write it. A tool can recompile a contract's verified source, for example from Sourcify, with a newer compiler. That gives different bytecode, though the storage layout usually carries over. The rules that today's tools use to guess layouts are usually right. We can write those rules down once as ethdebug data, as the Vyper figure earlier does by hand, so that each tool doesn't need its own copy. Runtime Verification had the same idea, and earlier this year they started a tool that adds ethdebug data to existing solc output. No one has taken on most of this work yet.
Next steps
You can try solc's ethdebug data today. With solc 0.8.38, compile a contract like this:
solc --experimental --via-ir \
  --debug-info ast-id,ethdebug \
  --ethdebug-resources \
  --ethdebug-program-runtime Contract.sol
Then read its output with the ethdebug format specification open to see how the parts fit together.
You don't need to build a debugger to use this data. Think of a question about a transaction that a tool could answer from it. Which source lines did it run? Which variable did a storage write change? Then ask an AI coding assistant to write that tool. Give it the specification and your compiler's output. For example, this short script prints the source lines a transaction ran, from solc's output or Fe's. Tool builders can use our npm packages to follow ethdebug pointers. Compiler writers can start with source ranges and add ethdebug pointers for state variables next.
If something in the format is missing, unclear, or wrong for your language or tool, open an issue. Some of this year's changes began as questions from compiler writers and tool builders.
The format will keep growing as more compilers write ethdebug data and solc's support expands. To follow along or ask a question, join our Matrix chat.
Thanks to Djordje and Roman at Walnut, the Solidity team (cameel and clonker in particular), the Fe team, Raoul at Runtime Verification, Sourcify, and Lea at Argot Collective for their work, their questions, and their patience. Thanks also to Jacob at Solidity for a last-minute review that made this post much better.